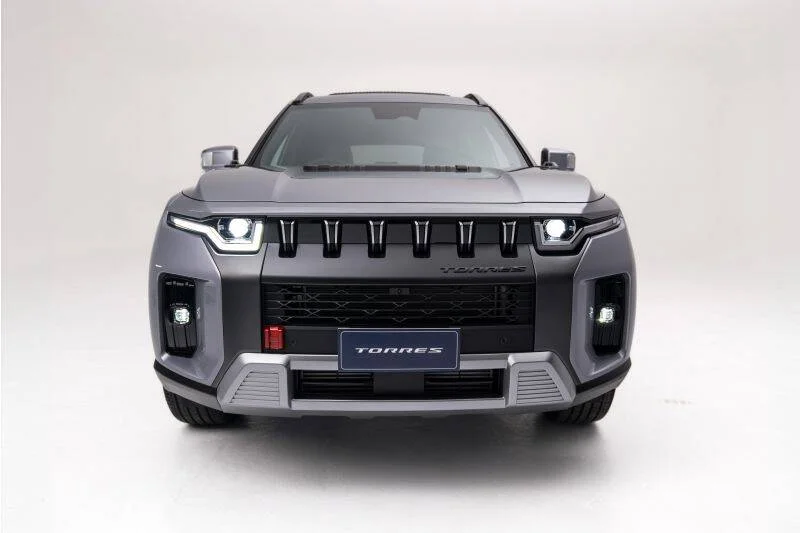
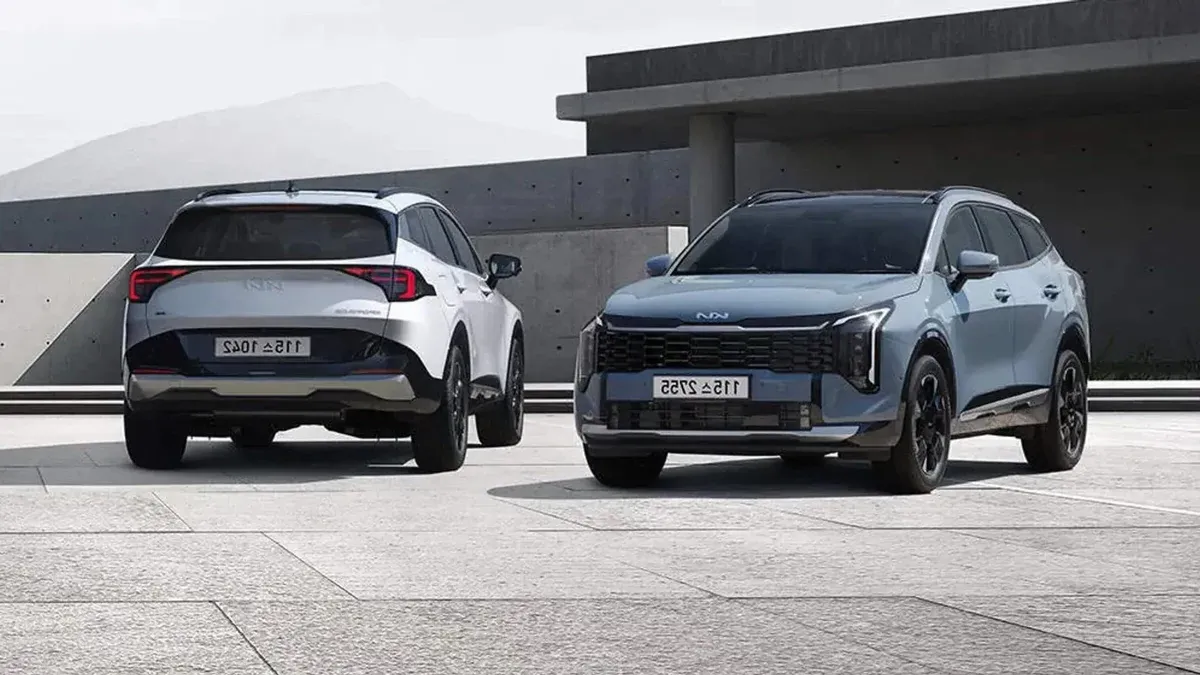
KGM Torres vs Kia Sportage
A detailed look at how two of Australia's most popular SUVs compare on price, running costs, safety, and everyday livability.
Specifications and pricing correct at time of publishing. Prices are RRP before on-road costs unless stated otherwise. Always confirm with the manufacturer or dealer before purchasing.
Price Breakdown
The KGM Torres starts from $34,990 before on-road costs, while the Kia Sportage opens at $38,490. That makes the KGM Torres the more affordable entry point by $3,500.
Once you factor in stamp duty, registration, CTP insurance, and dealer delivery, expect to add roughly 8-12% on top of the RRP depending on your state. That puts estimated driveaway prices in the ballpark of $38,489 and $42,339 respectively.
Over 5 years, the running costs favour the Kia Sportage by roughly $2,425 in fuel alone.
Safety Rundown
Both the KGM Torres and Kia Sportage hold a 5-star ANCAP safety rating.
Where the two diverge is in active safety technology. The Kia Sportage packs more ADAS features with 3 out of 10 key systems fitted, compared to 2 in the KGM Torres.
Both include the essentials: autonomous emergency braking, a reversing camera. Airbag count is 7 in the KGM Torres and 6 in the Kia Sportage.
Feature Showdown
The KGM Torres features a 12.3-inch touchscreen, while the Kia Sportage gets a 12.3-inch display and 4-inch instruments. Apple CarPlay and Android Auto are standard across both.
The KGM Torres stands out with ambient lighting that you will not find on the Kia Sportage. Which feature set matters more depends on your daily routine and priorities.
Drivetrain
The KGM Torres uses a Turbo GDi producing 120kW and 280Nm of torque, sent through a 6-speed automatic to a FWD layout. It covers the 0-100km/h sprint in 11.8 seconds.
The Kia Sportage responds with a Petrol making 115kW and 192Nm, paired to a automatic driving the front wheels. It gets to 100km/h in 8.5 seconds.
The KGM Torres has the clear power advantage at 120kW vs 115kW. In the real-world sprint, the Kia Sportage is 3.3s quicker. For most buyers, the way each car feels day-to-day matters more than outright acceleration.
Space & Comfort
The KGM Torres measures 4,700mm long on a 2,700mm wheelbase, 15mm longer than the Kia Sportage at 4,685mm (2,755mm wheelbase). The longer wheelbase on the Kia Sportage generally means more rear legroom.
Boot space is 455L in the KGM Torres and 543L in the Kia Sportage, giving the Kia Sportage a 88L advantage.
For towing, the Kia Sportage leads with a 1,650kg braked capacity vs 1,500kg. That 150kg difference matters if you regularly hitch up.
Turning Circle
Kerb-to-kerb diameter. Smaller turns easier in tight carparks and U-turns.
11.2m to 11.4m
Based on 11.2m turning circle:
- U-turn on standard street (7m+ wide)
- Standard parking bay
- Tight carparks
- Narrow laneways
Based on 11.4m turning circle:
- U-turn on standard street (7m+ wide)
- Standard parking bay
- Tight carparks
- Narrow laneways
Turning circle ratings
True Cost to Own
Based on 15,000km of annual driving, fuel costs roughly $2,252/year for the KGM Torres and $1,767/year for the Kia Sportage. That is a $485 annual difference in favour of the Kia Sportage.
Estimated annual total: $2,252 (KGM Torres) vs $1,767 (Kia Sportage). The Kia Sportage saves you roughly $485 per year in total ownership costs. Use our Fuel Cost Calculator to estimate based on your driving.
Warranty: 7 years / 999,999km (KGM Torres) vs 7 years / 999,999km (Kia Sportage). Both match on warranty length.
Who Should Buy Which?
Buy the KGM Torres if: You want the lower entry price, prioritise performance, or prefer KGM's approach to design and ownership experience.
Buy the Kia Sportage if: You need more boot space, want lower running costs, need stronger towing, or prefer Kia's approach to design and ownership experience.
The Verdict
The Kia Sportage takes 4 of 6 key spec categories. The Kia Sportage will save you roughly $485 a year in fuel. If boot space matters, the Kia Sportage has a clear edge. The best pick depends on what you value most. Explore the full specs for each model below.
Disclaimer: All information in this comparison was believed to be correct at the time of publishing (20 April 2026). Prices are manufacturer recommended retail prices (RRP) and may vary by state, dealer, and options. Driveaway costs include estimated on-road costs for Victoria. Fuel economy figures are WLTP/ADR combined cycle. Specifications can change without notice. Always verify with the manufacturer before making a purchase decision. CarSorted does not accept payment for recommendations.
Published by CarSorted Editorial Team · 20 April 2026
Comments (0)
Sign in to join the conversation
No comments yet. Be the first!