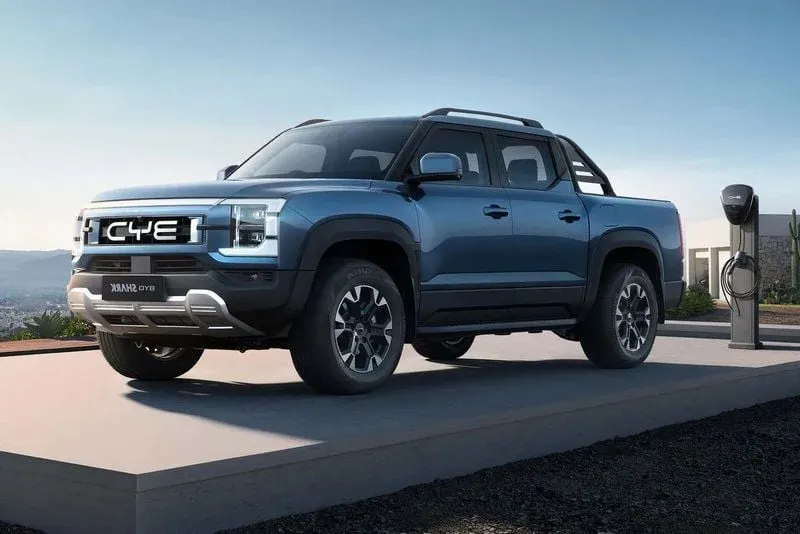
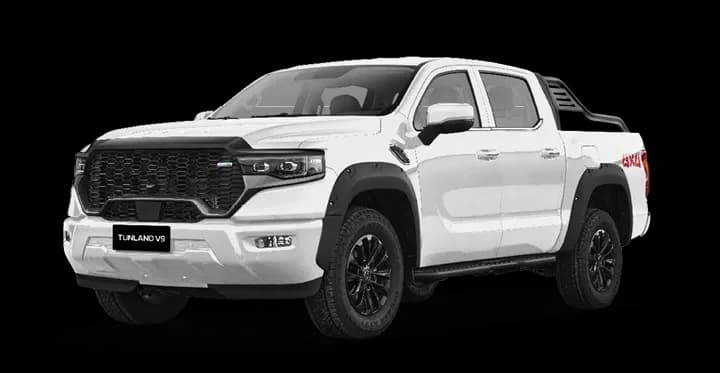
BYD Shark 6 vs Foton Tunland
A detailed look at how two of Australia's most popular Utes compare on price, running costs, safety, and everyday livability.
Specifications and pricing correct at time of publishing. Prices are RRP before on-road costs unless stated otherwise. Always confirm with the manufacturer or dealer before purchasing.
Plug-in hybrid fuel economy is shown as a hybrid (battery depleted) so it compares fairly with the other car. A PHEV's official "combined" figure assumes you start every trip fully charged, so real-world economy depends on how often you plug in. Electric range shows how far it goes before the petrol engine is needed.
Price Breakdown
The BYD Shark 6 starts from $55,900 before on-road costs, while the Foton Tunland opens at $39,990. That makes the Foton Tunland the more affordable entry point by $15,910.
Once you factor in stamp duty, registration, CTP insurance, and dealer delivery, expect to add roughly 8-12% on top of the RRP depending on your state. That puts estimated driveaway prices in the ballpark of $61,490 and $43,989 respectively.
The BYD Shark 6 qualifies for FBT exemption as an electric vehicle, which can dramatically reduce the effective cost for novated lease buyers. The Foton Tunland, as a petrol model, does not qualify.
Over 5 years, the running costs favour the BYD Shark 6 by roughly $9,650 in fuel alone.
Safety Rundown
ANCAP safety ratings have not been published for both models yet. We will update this section when crash test results are available.
Feature Showdown
The BYD Shark 6 features a 12.8-inch touchscreen paired with a 10.3-inch digital dash, while the Foton Tunland gets a 10.3-inch display and 12.3-inch instruments. Apple CarPlay and Android Auto are standard across both.
The BYD Shark 6 stands out with V2L that you will not find on the Foton Tunland. Which feature set matters more depends on your daily routine and priorities.
Interior trim differs: the BYD Shark 6 gets synthetic leather upholstery while the Foton Tunland offers leatherette.
Drivetrain
The BYD Shark 6 uses a Hybrid producing 321kW and 650Nm of torque, sent through a automatic to a AWD layout. It covers the 0-100km/h sprint in 5.7 seconds.
The Foton Tunland responds with a Turbo-diesel mild hybrid making 120kW and 450Nm, paired to a automatic driving the rear wheels. It gets to 100km/h in 11 seconds.
The BYD Shark 6 has the clear power advantage at 321kW vs 120kW. In the real-world sprint, the BYD Shark 6 is 5.3s quicker. For most buyers, the way each car feels day-to-day matters more than outright acceleration.
Space & Comfort
The BYD Shark 6 measures 5,457mm long on a 3,260mm wheelbase, 92mm longer than the Foton Tunland at 5,365mm (3,155mm wheelbase). The longer wheelbase on the BYD Shark 6 generally means more rear legroom.
0For towing, the Foton Tunland leads with a 3,500kg braked capacity vs 2,500kg. That 1,000kg difference matters if you regularly hitch up.
Turning Circle
Kerb-to-kerb diameter. Smaller turns easier in tight carparks and U-turns.
12.6m to 13.5m
Based on 13.5m turning circle:
- U-turn on standard street (7m+ wide)
- Standard parking bay
- Tight carparks
- Narrow laneways
Based on 12.6m turning circle:
- U-turn on standard street (7m+ wide)
- Standard parking bay
- Tight carparks
- Narrow laneways
Turning circle ratings
True Cost to Own
Based on 15,000km of annual driving, fuel costs roughly $379/year for the BYD Shark 6 and $2,309/year for the Foton Tunland. That is a $1,930 annual difference in favour of the BYD Shark 6.
Estimated annual total: $379 (BYD Shark 6) vs $2,309 (Foton Tunland). The BYD Shark 6 saves you roughly $1,930 per year in total ownership costs. Use our Fuel Cost Calculator to estimate based on your driving.
Warranty: 6 years / 150,000km (BYD Shark 6) vs 7 years (Foton Tunland). The Foton Tunland has longer coverage. Capped-price servicing: —7yr (Foton Tunland).
Who Should Buy Which?
Buy the BYD Shark 6 if: You prioritise performance, want lower running costs, or prefer BYD's approach to design and ownership experience.
Buy the Foton Tunland if: You want the lower entry price, value a longer warranty, need stronger towing, or prefer Foton's approach to design and ownership experience.
The Verdict
This is genuinely close. The BYD Shark 6 and Foton Tunland trade blows across the spec sheet, and neither runs away with an outright win. The BYD Shark 6 will save you roughly $1,930 a year in fuel. The Foton Tunland adds peace of mind with a longer 7-year warranty. The best pick depends on what you value most. Explore the full specs for each model below.
Common questions
Which is cheapest, BYD Shark 6 and Foton Tunland?
The Foton Tunland is the cheapest at $39,990 before on-road costs. That undercuts the BYD Shark 6 by $15,910.
Which is the most fuel-efficient?
The BYD Shark 6 uses the least fuel at 2L/100km on the combined cycle.
Which is safest?
They are evenly matched — BYD Shark 6 all hold a 5-star ANCAP rating. Compare the active-safety features above to separate them.
Which can tow the most?
The Foton Tunland has the highest braked towing capacity at 3,500kg.
Which has the best warranty?
The Foton Tunland has the longest warranty at 7 years.
Which is the most powerful?
The BYD Shark 6 makes the most power at 321kW. The BYD Shark 6 is quickest to 100km/h in 5.7s.
Disclaimer: All information in this comparison was believed to be correct at the time of publishing (20 April 2026). Prices are manufacturer recommended retail prices (RRP) and may vary by state, dealer, and options. Driveaway costs include estimated on-road costs for Victoria. Fuel economy figures are WLTP/ADR combined cycle. Specifications can change without notice. Always verify with the manufacturer before making a purchase decision. CarSorted does not accept payment for recommendations.
Auto-generated from CarSorted's specification data · 20 April 2026
Comments (0)
Sign in to join the conversation
No comments yet. Be the first!