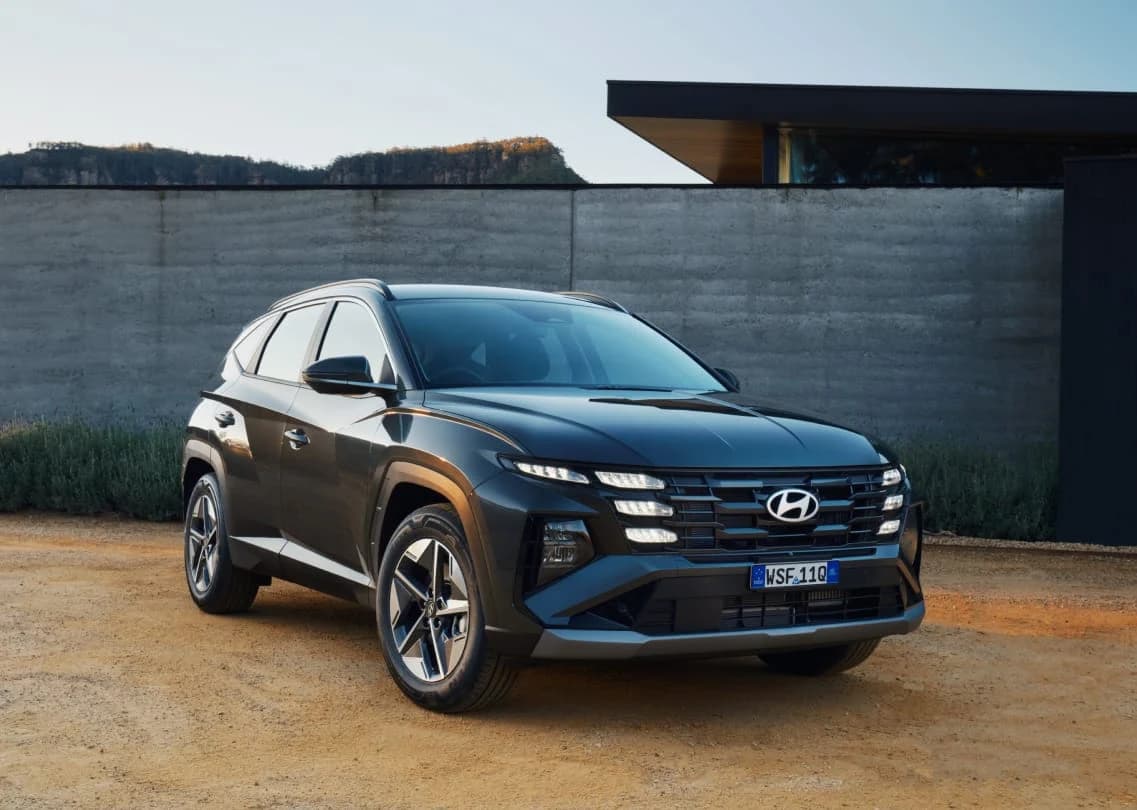
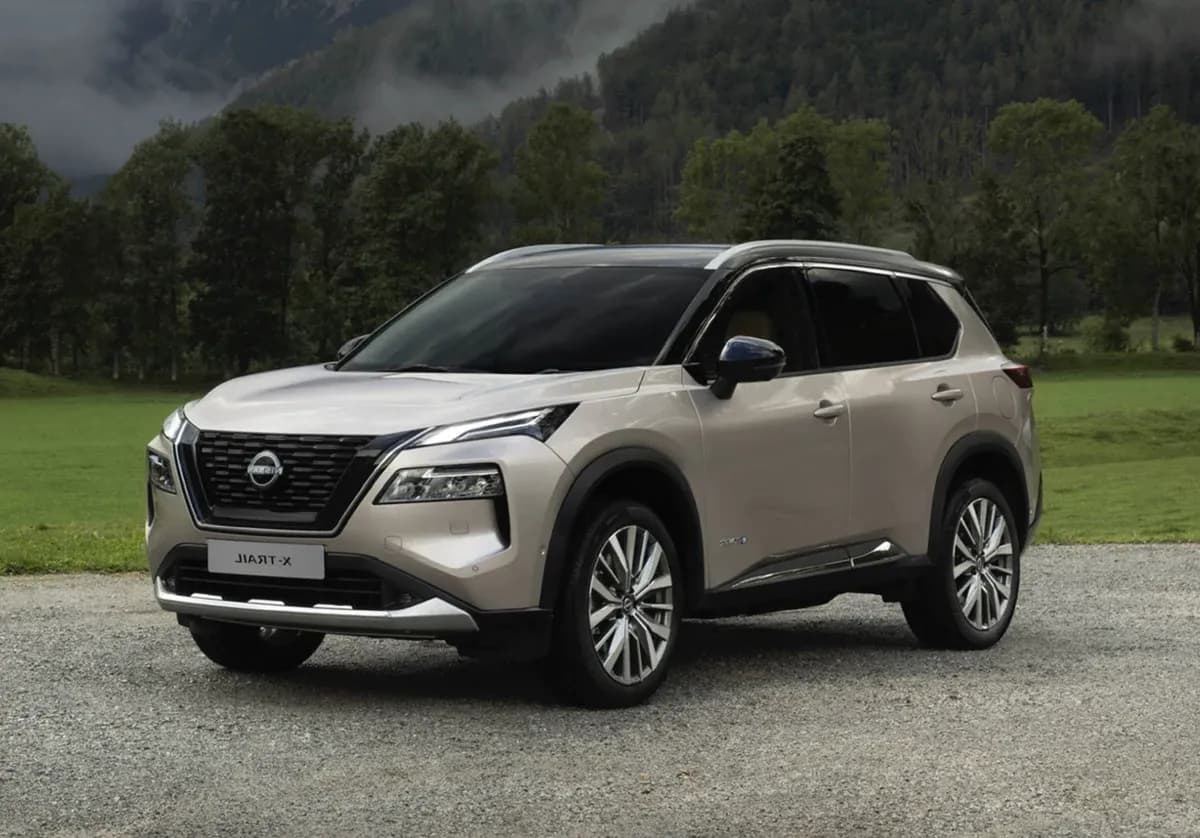
Hyundai Tucson vs Nissan X-Trail
A detailed look at how two of Australia's most popular SUVs compare on price, running costs, safety, and everyday livability.
Specifications and pricing correct at time of publishing. Prices are RRP before on-road costs unless stated otherwise. Always confirm with the manufacturer or dealer before purchasing.
Track the Hyundai Tucson & Nissan X-Trail
Get price-drop alerts on these models plus our free weekly new-car rundown. Unsubscribe anytime.
Price Breakdown
The Hyundai Tucson starts from $38,900 before on-road costs, while the Nissan X-Trail opens at $38,140. That makes the Nissan X-Trail the more affordable entry point by $760.
Once you factor in stamp duty, registration, CTP insurance, and dealer delivery, expect to add roughly 8-12% on top of the RRP depending on your state. That puts estimated driveaway prices in the ballpark of $42,790 and $41,954 respectively.
Over 5 years, the running costs favour the Nissan X-Trail by roughly $1,000 in fuel alone.
Safety Rundown
Both the Hyundai Tucson and Nissan X-Trail hold a 5-star ANCAP safety rating. Adult occupant protection scored 86% for the Hyundai Tucson and 91% for the Nissan X-Trail.
Where the two diverge is in active safety technology. The Nissan X-Trail packs more ADAS features with 6 out of 10 key systems fitted, compared to 4 in the Hyundai Tucson.
Both include the essentials: autonomous emergency braking, lane keep assist, adaptive cruise control, a reversing camera.
Feature Showdown
The Hyundai Tucson features a 12.3-inch touchscreen paired with a 4-inch digital dash, while the Nissan X-Trail gets a 8-inch display and 7-inch instruments. Apple CarPlay and Android Auto are standard across both.
Drivetrain
The Hyundai Tucson uses a Petrol producing 115kW and 192Nm of torque, sent through a automatic to a FWD layout. It covers the 0-100km/h sprint in 9.2 seconds.
The Nissan X-Trail lines up making 135kW and 244Nm, paired to a automatic driving the front wheels. It gets to 100km/h in 8 seconds.
The Nissan X-Trail has the clear power advantage at 135kW vs 115kW. In the real-world sprint, the Nissan X-Trail is 1.2s quicker. For most buyers, the way each car feels day-to-day matters more than outright acceleration.
Space & Comfort
The Hyundai Tucson measures 4,640mm long on a 2,755mm wheelbase, 40mm shorter than the Nissan X-Trail at 4,680mm (2,705mm wheelbase). The longer wheelbase on the Hyundai Tucson generally means more rear legroom.
Boot space is 539L in the Hyundai Tucson and 205L in the Nissan X-Trail, giving the Hyundai Tucson a 334L advantage.
For towing, the Nissan X-Trail leads with a 2,000kg braked capacity vs 1,650kg. That 350kg difference matters if you regularly hitch up.
Turning Circle
Kerb-to-kerb diameter. Smaller turns easier in tight carparks and U-turns.
11.1m to 11.8m
Based on 11.8m turning circle:
- U-turn on standard street (7m+ wide)
- Standard parking bay
- Tight carparks
- Narrow laneways
Based on 11.1m turning circle:
- U-turn on standard street (7m+ wide)
- Standard parking bay
- Tight carparks
- Narrow laneways
Turning circle ratings
True Cost to Own
Based on 15,000km of annual driving, fuel costs roughly $2,309/year for the Hyundai Tucson and $2,109/year for the Nissan X-Trail. That is a $200 annual difference in favour of the Nissan X-Trail.
Estimated annual total: $2,309 (Hyundai Tucson) vs $2,109 (Nissan X-Trail). The Nissan X-Trail saves you roughly $200 per year in total ownership costs. Use our Fuel Cost Calculator to estimate based on your driving.
Warranty: 5 years (Hyundai Tucson) vs 5 years / 999,999km (Nissan X-Trail). Both match on warranty length.
Who Should Buy Which?
Buy the Hyundai Tucson if: You need more boot space, or prefer Hyundai's approach to design and ownership experience.
Buy the Nissan X-Trail if: You want the lower entry price, prioritise performance, want lower running costs, need stronger towing, or prefer Nissan's approach to design and ownership experience.
The Verdict
The Nissan X-Trail takes 5 of 6 key spec categories and comes in at a lower price. The Nissan X-Trail will save you roughly $200 a year in fuel. If boot space matters, the Hyundai Tucson has a clear edge. The best pick depends on what you value most. Explore the full specs for each model below.
Common questions
Which is cheapest, Hyundai Tucson and Nissan X-Trail?
The Nissan X-Trail is the cheapest at $38,140 before on-road costs. That undercuts the Hyundai Tucson by $760.
Which is the most fuel-efficient?
The Nissan X-Trail uses the least fuel at 7.4L/100km on the combined cycle.
Which is safest?
They are evenly matched — Hyundai Tucson and Nissan X-Trail all hold a 5-star ANCAP rating. Compare the active-safety features above to separate them.
Which has the most boot space?
The Hyundai Tucson has the largest boot at 539L.
Which can tow the most?
The Nissan X-Trail has the highest braked towing capacity at 2,000kg.
Which is the most powerful?
The Nissan X-Trail makes the most power at 135kW. The Nissan X-Trail is quickest to 100km/h in 8s.
Free: Chinese Cars in Australia Cheat Sheet
Sign up free and we'll email you our Chinese Cars Cheat Sheet (PDF) — all 22 brands ranked on service, parts, warranty and dealer experience. Plus new-car launches, reviews and founding-member pricing on the upcoming CarSorted Pro Report. No spam, unsubscribe anytime.
By subscribing, you agree to receive marketing emails. You can unsubscribe at any time. View our Privacy Policy.
Disclaimer: All information in this comparison was believed to be correct at the time of publishing (20 April 2026). Prices are manufacturer recommended retail prices (RRP) and may vary by state, dealer, and options. Driveaway costs include estimated on-road costs for Victoria. Fuel economy figures are WLTP/ADR combined cycle. Specifications can change without notice. Always verify with the manufacturer before making a purchase decision. CarSorted does not accept payment for recommendations.
Auto-generated from CarSorted's specification data · 20 April 2026
Comments (0)
Sign in to join the conversation
No comments yet. Be the first!